Watersheds and the James River
Because of our hilly terrain, water flowing across the land quickly flows into one of the many creeks and streams in Botetourt County and Craig County. Together, the land and water make up an area’s watershed.
Water Science Basics: What is the Water Cycle? (USGS)
Water Properties and Measurements (USGS)
Water Cycle for Schools (USGS)
Rivers and Watersheds (Virginia Places)
ABC’s of Hydrogeology (Virginia Association of Soil and Water Districts)
Physiographic Provinces of Virginia (Virginia Department of Environmental Quality)
These relatively small bodies of water sooner or later drain to one of three major Virginia rivers. Much of Botetourt and Craig drains to the James River and then on to the Chesapeake Bay. The southern portion of Botetourt drains to the Roanoke River, which flows into North Carolina’s Albemarle Sound. The western edge of Craig County drains to the New River, which flows into the Mississippi and on the the Gulf of Mexico. That’s quite a trip!
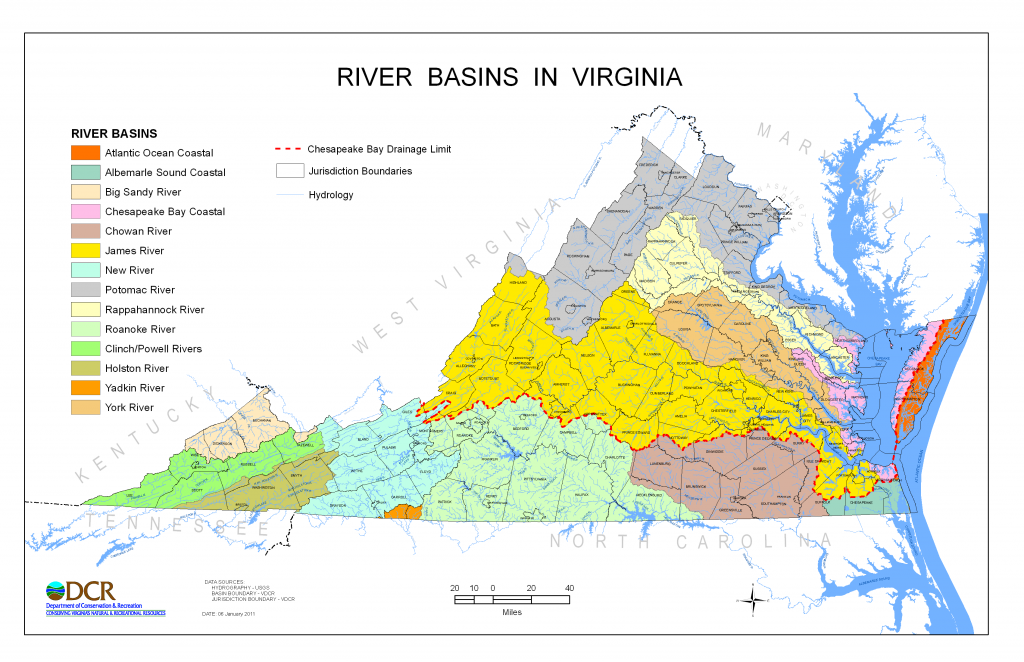 Click on image for a larger version.
Parts of a Stream (Pennsylvania Envirothon)
The James River makes a number of meanders on its way to the Chesapeake Bay, including some in Botetourt County. Learn more about how meanders and oxbow lakes form…
Learn more about the James River and ways to protect it from these conservation organizations:
The Chesapeake Bay
An estuary is a place where fresh water from rivers mixes with salt water from the ocean. The Chesapeake Bay is the largest estuary in the U.S. Largely because of unchecked nonpoint source pollution from the Chesapeake Bay’s seven-state watershed, the Bay remains a national treasure that is in trouble.
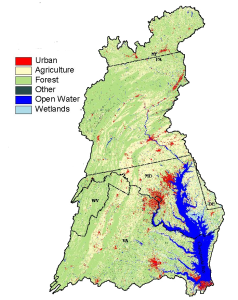
Click here to learn more about pollution issues, the impact of land use in the watershed, and pollution reduction goals.
Click here to access amazing high-resolution LAND COVER DATA for the entire watershed (by Chesapeake Conservancy)
Get a great overview on the role of clams and oysters in the Chesapeake Bay by watching this episode of “In the Americas.”
How is the health of the Bay? Read the latest “State of the Bay” report from the Chesapeake Bay Foundation and the “Bay Barometer” from the Chesapeake Bay Program.
Learn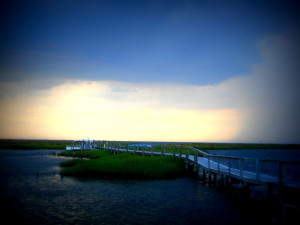 more about the Chesapeake Bay and efforts to protect it from these organizations:
Chesapeake Conservancy (featuring great wildlife webcams)
Alliance for the Chesapeake Bay
Tangier Island
Tangier is a tiny island in the middle of the Chesapeake Bay whose residents make their living from the water. The combination of island erosion and sea level rise make it likely that their island home will someday disappear.
“Tangier, the Sinking Island in the Chesapeake” (article from the New Yorker)
“Should the United States Save Tangier Island from Oblivion?” (article from the New York Times Magazine)
More videos about the Chesapeake Bay from the Chesapeake Bay Program…
Bay 101: Sediment
Bay 101: Wastewater Treatment Plants
Bay 101: Fish Food
Bay 101: Microplastics
Bay 101: Conowingo Dam
Click here for even more great resources and short video topics from the Chesapeake Bay Program.
STEM connection — Learn how NASA uses satellites to monitor the land use around the Chesapeake Bay
Pollution
The Chespeake Bay is polluted because of the tributaries that flow into it. The James River is the second largest tributary of the Bay (the largest is the Susquehanna River, which flows out of Pennsylvania and Maryland into the northern part of the Bay). The James River is polluted somewhat by what gets dumped into it by factories and sewage treatment plants — pollutants that enter the river through a specific pipe. This type of point source pollution is harmful, but is relatively easy to control: deal with the specific factory (the polluter) and you deal with the pollution.
Nonpoint source pollution enters the water from runoff. Every single polluting land use in the watershed is part of the problem: homeowners, farms, golf courses, pavement & parking lots, cities & towns, and logging operations. No one single source creates a huge amount of pollution. Instead, ”a little bit here” and “a little bit there” quickly add up. Since nonpoint source pollution comes from a widespread area, it is much harder to control. However, forests and trees are a big part of the answer: they help filter pollutants out of runoff, keeping pollution fom reaching creeks and streams.
“Microplastics” are a growing area of concern associated withnonpoint source pollution — click here for a fascinating (and troubling) article from the Bay Journal about plastic in the Chesapeake Bay.
A cheesy, but fun, video about sediment pollution!
A cheesy, but fun, video about bacteria pollution!
Riparian Buffers
Biological Monitoring
Learn more about how to conduct a biological assessment of a stream with Virginia Save Our Streams. On-line identification resources are available here.
Brook trout, hellbenders, & other aquatic critters
Who cares about water quality? Brook trout and hellbenders do! Check out this gorgeous videos from Freshwater Illustrated.
Bringing Back the Brooks – A Revival of the South’s Trout from Freshwaters Illustrated on Vimeo.
More brook trout resources:
From the Field: Linking land and water in brook trout conservation from Chesapeake Bay Program on Vimeo.
“My Healthy Stream — A Handbook for Streamside Owners” (PDF from Trout Unlimited.)
More aquatics resources:
Freshwater Fish in Virginia (Virginia Dept. of Game and Inland Fisheries)
Aquatic Nuisance Species and species of concern (ANS Task Force)
Freshwater Mussels (VDGIF)
Amphibians in Virginia (VDGIF)
Virginia is for Frogs (VDGIF)
Amphibian and Reptile Fact Sheet (USDA-NRCS)
Vernal Pools in Virginia (VDGIF)
Secret Pond: A Fairy Shrimp Documentary from Mind Veneration on Vimeo.
Oceans
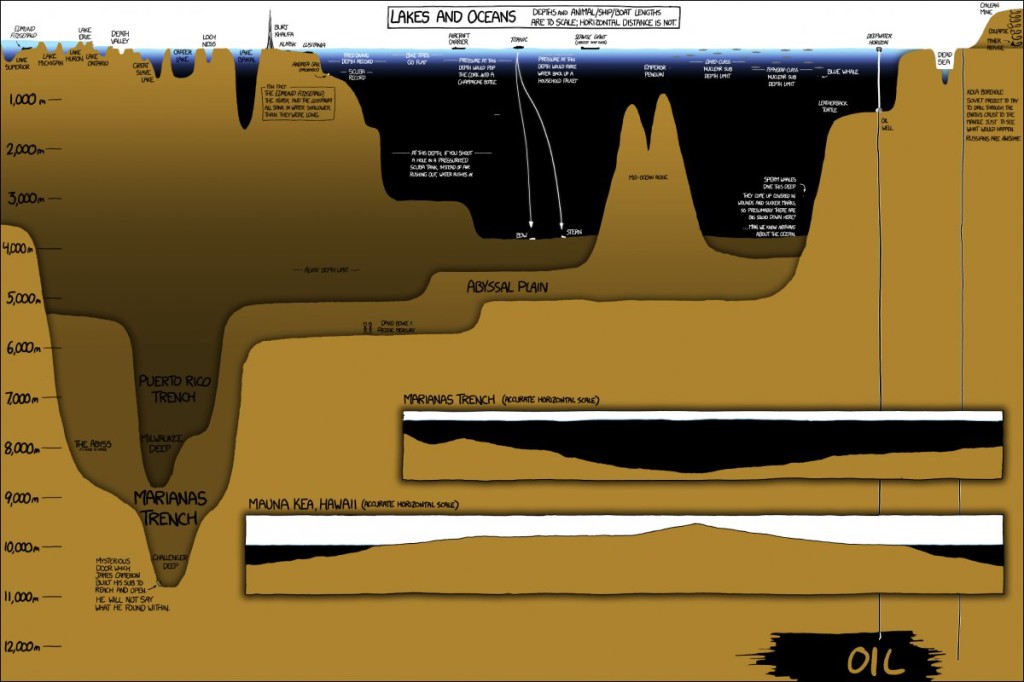 Ever really thought about the amazing depth of our oceans? Underwater places make up 95% of earth’s living space and much of it is unexplored! Click here for an awesome infographic on the scale of underwater regions.